Every year the End Child Poverty Coalition, together with Loughborough University, publishes child poverty statistics for every Westminster Constituency and Local Authority across the country. You can find out more here.
So what do this year’s figure tell us?
1. 3.6 million children aged 0 to 15 were living in poverty between 2021/22 – this year’s data was released just as Boris Johnson stood down as Prime Minister, and a new leadership contest was established. It is likely that all political decisions will now be on hold until a new leader is elected. However, for millions of children this same time may be fraught with worry. Some of these children will be missing out on their free school meals as we approach the summer holidays. Families could be facing huge childcare costs to allow them to work over the summer months whilst their children are not in school. And alongside the rising cost of living crisis millions of families will be worrying about where their next meal is coming from or how they will pay their bills. You can remind your MP of the need to keep children in low income families at the centre of decision making by taking action here.
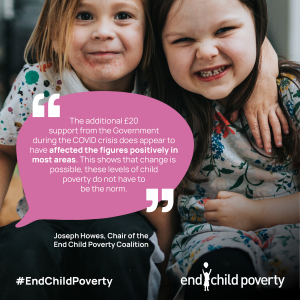
2. This year’s figures were the only year child poverty levels reduced by more than one percentage point since 2010. This was also the year the temporary £20 uplift to Universal  Credit was introduced, which experts say reduced child poverty levels – demonstrating that changes to the benefits system, which put money in family’s pockets can quickly impact levels of child poverty. This uplift has since been removed.
3. Regionally the North East has seen the sharpest increase in child poverty levels, up 7 percentage points from 2010/11. One reason for this could be that many people in the North East did not qualify for the £20 uplift in Universal Credit payments, because they were receiving the older ‘legacy’ benefits – such as housing benefit or income support. Many families in the region where therefore pushed further into poverty as a result of an unfair policy decision.
4. The highest rates of child poverty continue to be in major cities and London boroughs. Over half of children growing up in Tower Hamlets are living in poverty and over 40% of children are growing up in poverty in five more London boroughs. Yet London doesn’t top the region with the highest levels of poverty because there are huge disparities between boroughs. For example, in Richmond the figure is 15.6% and in the City of London only 9.5% of children are living in poverty.
5. Whilst our data shows where children are living in poverty, it doesn’t show who these families are. But we know from the latest data available* that children from Black and minority ethnic groups are more likely to be in poverty, at 46%, compared with 26% of children in white British families. We also know that single parents and parents with disabled children are much more likely to be living in poverty.
Interested in finding out more? You can download the full report and data tables. You can also use our interactive map to look for child poverty levels in your area.
* Calculations from Households Below Average Income statistics on the number and percentage of people living in low income households for financial year 2019/20, Tables 4_3db & 4_5db. Department for Work and Pensions.
Notes on how the data should be interpreted – for use online and in press releases
The figures are based on the Department for Work and Pensions Children in low income families: local area statistics which estimates the poverty rate before housing costs. A statistical model is used to estimate child poverty after housing costs which draws on household survey data alongside local area statistics on private rent levels. The statistics are calibrated to regional 3-year averages from Households Below Average Income (HBAI) for the financial years 2018/19 to 2020/21. The HBAI figures for 2020/21 are less reliable than earlier years due to sampling issues related to the pandemic. This should be kept in mind when interpreting the statistics released today, but the impact is lessened by the use of three-year averages for regional figures. More information on HBAI is available here.
Users are advised that the data for individual local authorities and parliamentary constituencies are subject to small statistical fluctuations year-on-year and should be considered within the context of the regional or the longer-term local trend.

