Children are living in families impacted by the two-child limit everywhere in the UK
Quick Links:
- the data on the number of children impacted by the two-child limit in each Westminster Constituency and Local Authority
- the briefing document for MPs
- Take action: email your MP
- Read our national, in nation and regional press releases
“I am a single parent to three children. My youngest was born in May 2017 – so we were one of the first families to be hit by the two-child limit. This policy had a huge impact on our family. I had to put my 3-month-old son into childcare so that I could go and wash pots in order to pay for essentials. I often had to choose between paying for new clothes for my children or paying the gas and electricity bill. I had to take out loans to be able to afford food.
Today, I am still impacted by this policy psychologically. My children have even said that they don’t want kids of their own because they have seen me struggle.”
Rosie, mother to three children in the North East.
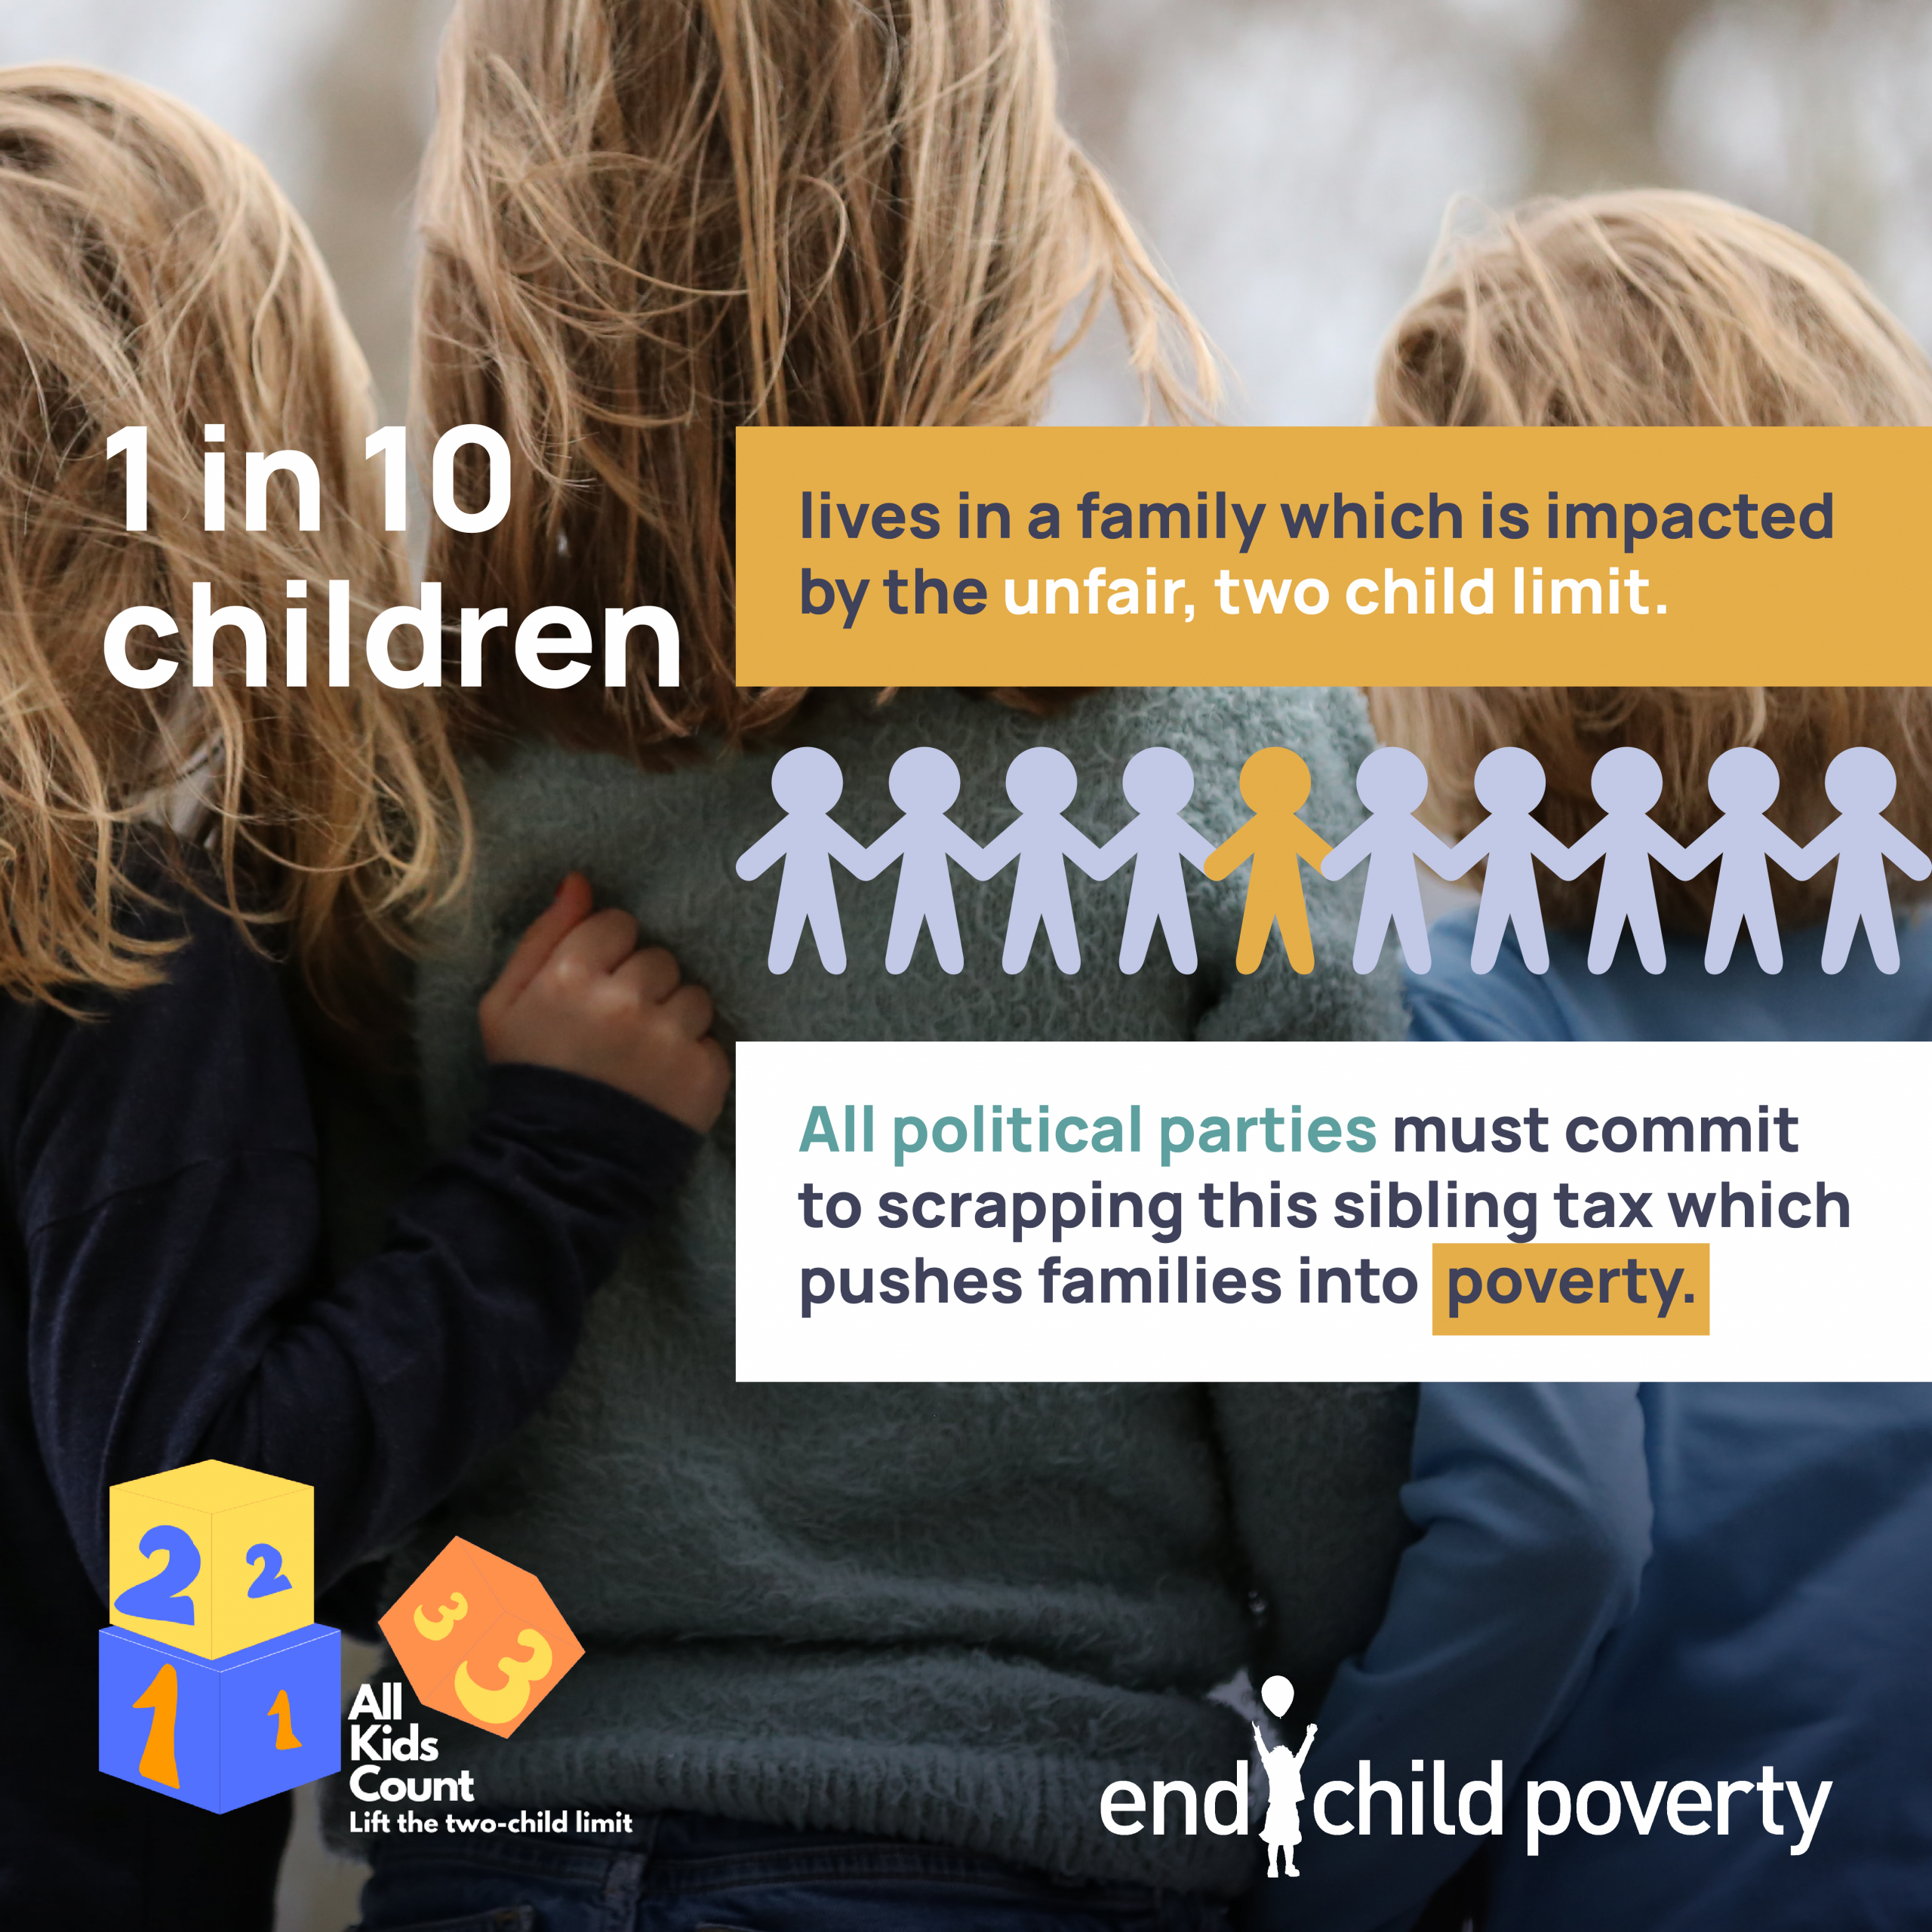
New data[1] obtained by the End Child Poverty Coalition shows the huge scale at which the two-child limit is impacting families across the UK. In April 2023 there were 1.5 million children affected by the two-child limit[2], this is equal to 1 in 10 children. This data provides the figure for children impacted by the two child limit in each Westminster Constituency, and each local Authority.
We also know that larger families are much more likely to experience poverty. The poverty rate for children in families with three or more children was 42%, compared with 23% and 22% among children in families with one or two children respectively[3].
A summary of the data:
- Across the UK 1.5 million children live in households who that are subject to the two-child limit to benefit payments. This is 1 child in every 10.
- Every UK constituency in the UK is now home to families impacted by this policy.
- But there is widespread variation across the country – in some constituencies the rate of children affected is as high as 3 in 10.
- There is a divide across England, with regions in the North of England seeing the highest levels of families impacted by the policy. The West Midlands is the region with the highest levels at 14%. In the North West and Yorkshire & Humber the figure is 13%. In the North East it is 12%.
- In general, the constituencies most affected by the two-child limit are those with the highest child poverty rates.
- The strong relationship between the limit and poverty is unsurprising as families subject to the two-child limit are missing out on up to £3,235 per child in 2023/24.
- Even in the South East, the least affected region, over 160,000 children’s life chances are blighted by this policy.
- The annual cost of scrapping the two-child limit is £1.3 billion – in 2023/24, making it the most cost-effective way to reduce child poverty. Doing so would immediately lift 250,000 children out of poverty .
Use the map below to find out how many children are impacted by the two-child limit to benefit payments in your constituency area.
The 20 Westminster constiuencies with the highest proportion of children living in families impacted by the two-child limit
| Gov name | Nation/ region | Total number of households affected | Total number of Children n these families | 3rd or more child | Total number of children living in the area | % of all children in area living in a family affected by the 2 child limit | Number of children living in poverty | % of children living in poverty |
| Blackley and Broughton | North West | 2860 | 11970 | 3760 | 37950 | 32% | 18761 | 49.4% |
| Hackney North and Stoke Newington | London | 2370 | 10860 | 3440 | 37106 | 29% | 14888 | 40.1% |
| Birmingham, Hodge Hill | West Midlands | 3030 | 11490 | 3610 | 43753 | 26% | 23630 | 54.0% |
| Birmingham, Ladywood | West Midlands | 2550 | 9590 | 3050 | 37977 | 25% | 20723 | 54.6% |
| Birmingham, Yardley | West Midlands | 2010 | 7440 | 2350 | 32198 | 23% | 16227 | 50.4% |
| Bolton South East | North West | 1770 | 6590 | 2110 | 29021 | 23% | 14781 | 50.9% |
| Bradford East | Yorkshire And The Humber | 2300 | 8480 | 2650 | 37912 | 22% | 16355 | 43.1% |
| Manchester Central | North West | 1900 | 7060 | 2230 | 31667 | 22% | 15216 | 48.1% |
| Leeds Central | Yorkshire And The Humber | 1970 | 7160 | 2300 | 32769 | 22% | 14553 | 44.4% |
| Birmingham, Erdington | West Midlands | 1590 | 5880 | 1860 | 27123 | 22% | 12043 | 44.4% |
| Manchester, Gorton | North West | 1810 | 6670 | 2130 | 30811 | 22% | 15656 | 50.8% |
| Bradford West | Yorkshire And The Humber | 2030 | 7460 | 2350 | 35521 | 21% | 15808 | 44.5% |
| Middlesbrough | North East | 1330 | 4880 | 1550 | 23553 | 21% | 11466 | 48.7% |
| Walsall North | West Midlands | 1440 | 5210 | 1700 | 25244 | 21% | 11443 | 45.3% |
| Oldham West and Royton | North West | 1690 | 6040 | 1920 | 29774 | 20% | 15272 | 51.3% |
| Leeds East | Yorkshire And The Humber | 1520 | 5700 | 1830 | 28202 | 20% | 12603 | 44.7% |
| Nottingham North | East Midlands | 1490 | 5380 | 1740 | 27084 | 20% | 9941 | 36.7% |
| Birmingham, Hall Green | West Midlands | 1790 | 6670 | 2080 | 33664 | 20% | 18090 | 53.7% |
| Blackburn | North West | 1730 | 6250 | 1980 | 31643 | 20% | 15714 | 49.7% |
| Leicester West | East Midlands | 1470 | 5490 | 1740 | 27911 | 20% | 10304 | 36.9% |
The 20 Local Authorities with the highest proportion of children living in families impacted by the two-child limit
| Gov name | Nation/ region | Total number of households affected | Total number of Children n these families | 3rd or more child | Total number of children living in the area | % of all children in area living in a family affected by the 2 child limit | Number of children living in poverty | % of children living in poverty |
| Hackney | London | 3400 | 14510 | 4600 | 61836 | 23% | 26816 | 43.4% |
| Manchester | North West | 7190 | 26530 | 8410 | 132312 | 20% | 59133 | 44.7% |
| Salford | North West | 2930 | 11870 | 3750 | 60536 | 20% | 22651 | 37.4% |
| Birmingham | West Midlands | 15860 | 58930 | 18570 | 301167 | 20% | 139704 | 46.4% |
| Tower Hamlets | London | 3980 | 13940 | 4470 | 72780 | 19% | 34580 | 47.5% |
| Pendle | North West | 1230 | 4500 | 1420 | 23813 | 19% | 10123 | 42.5% |
| Middlesbrough | North East | 1730 | 6280 | 1990 | 34330 | 18% | 13945 | 40.6% |
| Nottingham | East Midlands | 3410 | 12340 | 3950 | 68103 | 18% | 27937 | 41.0% |
| Hyndburn | North West | 960 | 3470 | 1100 | 19158 | 18% | 7963 | 41.6% |
| Burnley | North West | 1120 | 4030 | 1320 | 22475 | 18% | 9158 | 40.7% |
| Oldham | North West | 3160 | 11340 | 3620 | 63737 | 18% | 27760 | 43.6% |
| Stoke-on-Trent | West Midlands | 2810 | 10280 | 3290 | 59270 | 17% | 25812 | 43.5% |
| Bradford | Yorkshire and The Humber | 7010 | 25650 | 8100 | 147976 | 17% | 58143 | 39.3% |
| Blackburn with Darwen | North West | 1980 | 7170 | 2270 | 41522 | 17% | 17511 | 42.2% |
| Blackpool | North West | 1330 | 4900 | 1560 | 28478 | 17% | 11004 | 38.6% |
| Walsall | West Midlands | 3330 | 12090 | 3920 | 70455 | 17% | 30539 | 43.3% |
| Bolton | North West | 3390 | 12480 | 3990 | 73448 | 17% | 30586 | 41.6% |
| Rochdale | North West | 2690 | 9590 | 3080 | 56789 | 17% | 23019 | 40.5% |
| Sandwell | West Midlands | 4000 | 14500 | 4620 | 87849 | 17% | 39217 | 44.6% |
| Wolverhampton | West Midlands | 2890 | 10380 | 3380 | 63637 | 16% | 27568 | 43.3% |
The correlation between the percentage of children impacted by the two-child limit, and the percentage of children living in poverty – in each Westminster Constituency
[1] The data on the number of children subject to two-child limit was obtained via Freedom of Information requests to the Department of Work and Pensions, HMRC and the Department for Communities Northern Ireland. You can download the full spreadsheet of data here:
[2] From https://www.gov.uk/government/statistics/universal-credit-and-child-tax-credit-claimants-statistics-related-to-the-policy-to-provide-support-for-a-maximum-of-2-children-april-2022/universal-credit-and-child-tax-credit-claimants-statistics-related-to-the-policy-to-provide-support-for-a-maximum-of-2-children-april-2022#main-stories
[3] Stone, J. 2023. Local indicators of child poverty after housing costs, 2021/22. Available here: https://endchildpoverty.org.uk/wp-content/uploads/2023/06/Local-indicators-of-child-poverty-after-housing-costs_Final-Report-3.pdf